Archive for the ‘geographic information systems’ Category

The United Kingdom Identity Cards Act: A step toward public safety or a Big Brother state?

Sunday, December 16th, 2007

(written by Jones, who’s also in Intro to GIS)

On the 30th of March 2006, the United Kingdom government passed the Identity Cards Act. Under this act, citizens of the UK who renew their passports during or after 2008 will be issued an identification card that is linked to a government database, which is composed of up to fifty attributes for each and every citizen. The government has stated that until 2010 a UK citizen not renewing his or her passport has the option to apply for a card or not, but regardless of one’s decision, one is still placed in the government database, formally called the National Identity Register (NIR).

The NIR is a geocoded database which includes data such as a citizen’s name, current address(es), previous address(es), gender, date of birth, and place of birth. In addition to the usual attributes to identify a person, the Identity Cards Act requires a citizen to provide biometric information. Biometric information includes fingerprints, signatures, iris scans, and shoulder and head photographs. The UK government claims that with all this information it can better serve the public interest through tightening national security, detecting crime, controlling immigration, detecting illegal employment, and securing the effective and efficient provision of public services.

The new act has been met with much resistance within the UK. Many believe that the new system is too costly, may promote racial and ethnic discrimination, and invades the rights and privacy of individuals. Not only is one’s address of residence known, but whenever one must present one’s ID card one’s location can be recorded and added to the NIR as an attribute. One ID card resistance organization, NO2ID, notes that ID cards are basically primary keys in a database, linking a person and all of his or her information to a plethora of other databases. To use a credit card, for example, one might have to provide one’s ID card to prove that indeed the credit card belongs to the right person. As soon as that credit card is used, the store’s location, the store’s name, and the items bought can be linked to the NIR database. Not only can the government determine where you shop and how often you shop there, but it can determine what you buy. One can imagine a number of instances when the ID card would be used to verify identification: when buying a car, when applying for insurance, when leaving or entering the country, when voting, and when borrowing books from a library. Ultimately, since each citizen with an ID card is effectively geo-tagged whenever the card is used, the new cards may facilitate a Big Brother State, where the government not only knows where one goes, but largely what one is doing.

The Identity Cards Act effectively geotags each citizen of the United Kingdom and continually geotags them as they use their ID cards to verify their identification. This information can be added to the already geocoded NIR, enabling government officials to better know where one goes and what one is buying. If this wealth of information actually fulfills the purposes that the government states it will, or if it facilitates the invasion of one’s privacy and personal life, only time will tell; though I’m inclined to predict the latter.

clothes for surveillance

Sunday, December 16th, 2007

(Written by Intro to GIS student, Z.J. It’s interesting that, of all the topics mentioned in the course, the one that elicited the greatest discussion was the surveillance potential for GIS.)

161207075039.jpg

The Associated Press reports on Bladerunner, a clothing company in London, England that has developed a new jacket with a GPS tracker. The device is lodged within the jacket lining and can track the jacket anywhere in the world (with 43 feet resolution). Google Earth can be used to locate the individual. This raises the question: Have geospatial technologies gone too far? It isn’t so much that geographic information systems (GIS) pushes the boundaries in this case, but the product represents our desire to capitalize on any piece of technology as an expensive knee-jerk response to perceived dangers.

The company targets parents who are worried about missing children and, of course, lost jackets. The AP continues that the jacket “alerts” parents when a child skips school or goes places they aren’t supposed to. (I would imagine the child may have the sense to take the jacket off and leave it elsewhere when they don’t want to be tracked.)

The kid’s jacket costs $500; an adult size (presumably for Alzheimer’s patients) costs $700. A $20 tracking fee is charged monthly. I think that, for this price, it may just be more beneficial to save money and purchase a $70 jacket and a cellphone. [For all you parents out there, a cellphone would not necessarily be the cheaper option–Sieber.] The cellphone would allow for an open line of communication, and probably a healthier alternative in terms of trust in parent-child dynamics.

In terms of child safety, this jacket could prove beneficial in terms of kidnapping. However, at such exorbitant prices, you would potentially only be catering to overbearing, spendthrift parents who are likely already overprotective. In my opinion, it is just taking monetary advantage of overprotective parents. For instance, the battery for the tracker only lasts 18 hours and needs to be recharged, rendering it useless over a 24 hour period.

More importantly, is a jacket-tracker the best way to keep our kids safe? The company appears to have chosen an article of clothing that is commonly left in lockers, closets and the back of chairs, rendering it relatively useless in its capacity to ensure child safety. If a parent is so inclined to track his/her child then why not just spend $400 on a tracking device that can be placed in any article of clothing? Wrist GPS detectors are also available, yet I would imagine the alleged kidnapper may notice a cube with 3 inch sides weighing down a child’s arm. The site also says, “Big Brother, meet Big Mother”, which showcases the crossed boundaries encountered with this device. I advocate investing in regular jackets, cellphones, and GIS-free board games to strengthen that parent child bond.

4D GIS

Sunday, December 16th, 2007

(written by Intro to GIS student KdS)

I am just now starting to understand the Geographic Information (GIS) world in its 2D frame. So a 4D GIS seemed like a far fetched idea. I was shocked to learn that it is in fact not that far off at all. 4D GIS is already being implemented in some very interesting ways and in ways that would put 4D GIS to positive uses.

When most people think of using GIS for mapping they think of 2D and maybe even some 3D (into the z-axis), but in the future 4D GIS might become common place. In the realm of physics the 4th dimension is usually associated with time. Applying this to GIS allow us to add time changes to data, creating maps that change as time changes. One could make real time queries and receive real time results.

I came across two examples that illustrate the potential of 4D GIS. The first is already in practice in Kyoto, Japan, called “Kyoto virtual time-space”. The second is a proposed idea for using 4D GIS to create constantly up-to-date maps that account for the constantly moving earth’s surface. This highlights two different but creative uses for 4D GIS technology.

At Ritsumeikan University in Kyoto Japan geography professors Yano Keiji , Nakaya Tomoki, and Isoda Yuzuru are working on a project titled Kyoto virtual time-space. This project utilizes 4D GIS to create a virtual environment of Kyoto Japan, by using 3D modelling that changes over time. One can travel through the streets of Kyoto in both space and time. The researchers hope to create a virtual museum of Kyoto that people would be able to access through virtual reality or the Internet. Aside from being useful as a historical tool, the program has very promising capabilities in urban planning and disaster management. The application can show to the public changes over time and hopefully achieve better social consensus around planning issues because the application can simulate reality. For example, realistic simulations can show the temporal impacts of building new high rises in a region or protecting certain areas. Researchers also talk about the application’s capabilities to create better disaster planning strategies and hazard maps.

The second example is proposed by Rahmi Nurhan Celik, N. Necla Ulugtekin and Caner Guney from Istanbul Technical University. The researchers are geodesists, so they are most interested in measurements and representations of earth. Their macro application of 4D GIS concentrates on the very base of map making so that the actual base map changes with changes of the earth. They argue that GIS, as currently envisioned, is based on stable geospatial information provision, including stable geodetic control and datum, when in fact it needs to be dynamic. In the universe there are no fixed points; everything is moving and so should GIS. The researchers focus on tectonic plates, the movement of which may be very small every year. However, in a earthquake prone area like Turkey a few centimetres can mean major damage and loss of life. They propose a system in which every time you query the data you get data from the time of the query. A series of control stations will always provide up to date data. The authors realize that the application will require considerable international cooperation, although they point out that organizations like the ITRF (International Terrestrial Frame) are already compiling global reference frames, an important step towards this 4D GIS future. They also point out the usefulness of the system for such issues as landslides or even tides. In the future a system like this could take this data and apply artificial intelligence to answer questions about the future of global change. They believe that even though it would require a large amount of effort, the application is well worth it and will soon be a part of the future.

Remote Sensing Used to Unlock Africa’s Hidden Potential

Monday, December 3rd, 2007

(written by Intro to GIS student, J.J., who’s provided a review of the use of remote sensing for mineral exploration.)

As easily accessible resources are being used up, it is becoming increasingly difficult to find new caches, even in resource-rich continents such as Africa. Cameroon has realized an advantage by using new satellite technology to catalogue its riches, while decreasing its exploration costs. As more foreign capital is invested in Africa – a record $38.8 billion in 2006 – the need to find blocks of previously undiscovered stores is becoming more urgent. Streaming data from 500 miles above the Earth’s surface, satellites use the STeP™ data processing technique (designed by Terra Energy & Resource Technologies, Inc.) to identify potential resource sites. Not only will this reduce the time needed to find, survey and extract resources at sites, but it will also allow the country to properly build infrastructure and allocate resources in a way that will also protect the economic and environmental future of Cameroon.

Satellite imagery has been used since the 1960’s to provide images of the Earth’s surface. In 1972 the United States launched the Landsat program to collect “spectral information from the Earth’s surface.” This has led to the creation of detailed archives that catalogue our interactions with the environment on a global scale, such as urban development and land use. Various other satellite imaging programs have sprung up since then, most notably in Europe with the ERS and Envisat systems. Satellite technology has come a long way, and newer industrial applications include geosensing (as in the case of Cameroon), agriculture, which can help in crop assessment, as well as environmental and meteorological change assessment, and real estate, where developers can use imagery to minimize construction costs and environmental impact.

STePâ„¢, has already seen success as a method for finding previously hidden resources. In 2002 it found a river in the west Saharan Desert 800 feet underground that today provides water to 50,000 citizens of Mauritania.

I believe that the practice of cataloguing a country’s resources will prove to be indispensable to every country in the coming decades. As preservation efforts increase in momentum, and calls for conservation of already used resources become louder, a complete roadmap for resources will aid in policy-making. With the first phase of the Kyoto Protocol coming a close in 2012 and the goals largely not have being met, we may find ourselves dramatically changing our resource consumption practices and an accurate schematic of global deposits may help with resource allocation.

Tracking Our Children with GPS: Does it Solve or Mask the Problem?

Monday, December 3rd, 2007

(written by Intro to GIS student, E. H.)
Growing up in New Hampshire I always watched the Boston news stations. A particular announcement came on every night before the ten o’clock news. It was a public service announcement that said “It is ten o’clock, Boston; Do you know where your children are?” This announcement was to remind parents to be active participants in their children’s lives and know where they were going and what they were doing. This question of “do you know where your children are?” has taken on a whole new meaning in recent years. In North America, most cell phone companies have created tracking services. The cell phones are equipped with GPS locators so that parents can watch where their geolocated children are in real time on a map on their own cell phones. It doesn’t stop there. New tools for tracking children are coming out everyday. The GPS nanny is hidden within a wristwatch given to kids by their parents. This device not only locates the child and warns the parent if they stray too far from them, but it also has the option to be equipped with a video camera, speaker, and microphone, as well as the ability to monitor the heart rate, blood pressure, and body temperature of the child. In recent years in Japan, several high-tech advances have come out for monitoring children, including built-in GPS locators in school uniforms and backpacks. Between April and July of 2006, a prototype for a child tracking system was tested in Yokohama Japan. One hundred and eighty-eight children in the region were tagged with wireless IC tags which transmitted radio signals to 27 sensors. If a child walked within 30 meters of a sensor an email was sent to their parents. This technology has been used in private schools to monitor when children arrive at and leave school and where they are during the time between leaving school and reaching home.

With the advent of all of this technology for pinpointing the exact locations and physical states of children at all times, one begins to wonder where the line should be drawn. When does tracking become overstepping boundaries and violating children’s rights? More importantly through this technology are parents distancing themselves from those they wish to keep safe? Are children no longer to be trusted? The phrase, “do you know where your children are?” no longer means “do you talk to your children and know who their friends are?” but rather “have you checked your laptop lately to see that the house they have entered is in the right part of town?” What happened to parents relying on themselves to protect their children? Have they become so busy and so wrapped up in themselves, that they can not take the time to walk children to the bus in the morning and pick them up at the end of the day or arrange for someone they trust to do so?

The recent increase in the fear of not knowing where children are at all times is not one that should be fixed with technology and tracking devices but rather with taking responsibility for kids and being good parents. Relying on technology to satisfy these fears is like taking cold medicine when one has a virus. Cold medicine will relieve the symptoms, but in doing so it prevents the body from actually fighting the virus and fixing the problem. In the same way, the use of technology to calm fears of where children are relieves the symptom but does not solve the problem of the break-down of communication with and the lack of active participation in the lives of children. I feel it is high time we that take a step back to evaluate what the real problem is and take steps toward solving it. This is not a matter having time to talk to children; it is a matter of making time, a matter of parents making their children a priority in their lives and not just another thing they must keep track of and monitor.

Applying GIS to K-12

Tuesday, November 27th, 2007

(written by Intro to GIS student E. L.)

While surfing the World Wide Web for high school curriculum information, I came across a research done by Steve Wanner and Joseph J. Kerski about the effectiveness of geographic information systems (GIS) in high school education. They point out that:

Concrete evidence of the effectiveness of geographic information systems in the curriculum is lacking. Research concerning the effectiveness of GIS technology and methods has been confined chiefly to anecdotal evidence from classroom observation. Experiments conducted in geography and special education courses in Boulder High School, Boulder Colorado, USA, provide some of the first empirical and case study data as to the effectiveness of GIS in teaching spatial and temporal relationships. Preliminary evidence suggests that students working with GIS demonstrate increased use of maps as analytical tools.

As a future teacher, I asked myself whether or not I will ever use GIS software in my classes and if GIS could be part of my curriculum. I strongly believe that GIS technology can be understood and used by high school students in geography classes. This research showed that the use of GIS technology in high school can be highly beneficial for both teacher and students. From my point of view, the only problem that would slow me from using GIS technology in my classes is money. I believe that using GIS in my classes will require extra money and I might not be able to gather the financial resources that will enable me to implement the technology. However, GIS seems to be a perfect teaching tool and a tool that will enable students to understand certain geographic concepts. I hope that GIS in high school is introduced as part of the geography curriculum in Quebec.

If I ever become a geography teacher, and let’s pretend that the Government of Quebec implements GIS in the curriculum, I would first introduce GIS to my students. I would give them a quick history as well as a demonstration of different features related to GIS. A good example would be using Goggle Earth and show the students different location on earth. I could even use Google Earth on a daily basis to assist me in visually showing my students geographic location related to the curriculum or activity that we would be doing in class. Also, I could produce user friendly maps using GIS applications that would enable me to set up class activities, tests and quizzes. Using GIS would certainly enhance the quality of the material that I would present to my students. Furthermore, I would set up a lab in which my students would become familiar with GIS programs such as Arc GIS. I would demonstrate how to use ArcGIS and then I would create simple assignments based on ArcGIS operations. Even though the complexity of my assignment wouldn’t be too high, I still believe that high school students are able to produce maps using the technology. All in all, there are many ways in which GIS can be use as a teaching tool in high school and I hope that I will see the day when I’ll be able to teach it at the high school level.

If you want more information about the effectiveness of GIS in high school, you can visit ESRI’s research web site, which contains all the results about the research discussed earlier. Increasinly, schools are moving towards implementing GIS in their curriculum. You can find information about this in the following websites. Enjoy!

http://www.hmsgis.multimedialearning.org/
http://www.tcla.gseis.ucla.edu/rights/features/3/gis.html
http://tcla.gseis.ucla.edu/divide/teachers/belcher.html

Source: Visited on November 27, 2007
http://gis.esri.com/library/userconf/proc99/proceed/papers/pap203/p203.htm
http://www.hmsgis.multimedialearning.org/
http://www.tcla.gseis.ucla.edu/rights/features/3/gis.html
http://tcla.gseis.ucla.edu/divide/teachers/belcher.html

growth of GIS in public health

Sunday, November 25th, 2007

(Written by Intro to GIS student, JvdB)

The benefits of GIS programs are becoming more apparent in public health care. In January 2008 the second semi-annual international symposium on HealthGIS will be held in Bangkok, Thailand. Its primary goal is to offer “a holistic picture of preparedness for combating epidemics and ensuring proper health care”. Previously, over 350 delegates from 22 countries took part in the hopes of planning strategies to combat diseases such as AIDS and malaria and to ensure safer and healthier living conditions.

Because of GIS’s ability to account for environmental spatial factors such as water quality, climate, and pollution as well as socio-economic spatial factors such as water management, proximity to healthcare facilities, and education, GIS analysis can help understand the impact of these factors on human health. An assessment of the spread of diseases over time, the spatial patterns of outbreaks, the population groups at most risk, the availability and access to health care can be made with the hopes of intervention and improvement.

The Public Health Agency of Canada has also been actively using GIS programs and continues to promote their usage. GIS is valued due to the spatial component existing in health data, the value of maps and visual representations with respect to public health data and the ability to correlate a variety of health data with other data such as census and environmental data.

GIS is used at all levels of government, from federal to local, including non-governmental organizations (NGOs) and research groups to coordinate information and research dealing with issues such as disease prevention, emergency preparedness and response and public health planning.

The use of GIS services in public health is growing and being recognized around the world. In addition to Canada and HealthGIS, ESRI is holding a health GIS conference in Washington, D.C. in the fall of 2008, to explore the use of GIS solutions in health services organizations around the world. ESRI also has a newsletter called HealthyGIS.

advanced metering infrastructure and GIS generate big savings for electricity utility

Sunday, November 18th, 2007

(this begins the first of numerous posts from my Intro GIS students on interesting applications of geospatial technologies. Written by student PT)

The Unitil utility company recently combined GIS with what they call advanced metering infrastructure to better manage and understand their network. The goal of the advanced metering infrastructure was initially to reduce the cost of meter reading in New Hampshire and Massachusetts. This means remotely reading meters as opposed to a visit from the utilities man or woman. According to Colorado Springs Utilities, many utility companies are using automated meter reading “as a way to improve customer service and control their meter reading costs, especially in areas with fenced yards, dogs, landscaping and other issues that make accessing meters difficult or unsafe.”

The concepts behind wireless meter reading are explained here and here. Since the data can be downloaded in real time this not only means faster data collection but also a constant monitoring of the performance of the system (e.g., it gives a utility company the ability to see where outages or blackouts occur).

Thanks to GIS, all the data collected is presented in a way that is hopefully more intuitive and beneficial to understanding the network and the customers’ needs. Not only would the company be more efficient but the data would be organized in way that is more convenient to location-based information sharing. Energy supply issues could be predicted with analytical tools available in standard GIS. This would help determine if there is the need for a larger transformer and give the proper time estimates for when a new business can be added to a given power network. The possibilities seem endless, for example, the history of tree trimming could be created and overlaid on the power line network as a way to enhance vegetation management, again with the help of analytical tools provided in GIS.

Congo pygmies go high-tech to protect forest home

Thursday, November 15th, 2007

Participatory GIS in action.

Using GPS handsets to pinpoint sacred sites and hunting areas, the nomadic forest dwellers are literally putting themselves on the map to protect their livelihoods and habitat against the chainsaws and bulldozers of commercial loggers.

satellite imagery for good

Saturday, September 22nd, 2007

The Summer edition of Imaging Notes is all about satellite imagery for climate change. Nice article on Google Earth’s outreach program, or what do you do after flying to your home?, SPOT’s Planet Action, and some striking images on the reaction of oceans to climate change.

shrinking ice

Saturday, August 11th, 2007

And you wonder why the Canadian government wants to establish two new military bases in Resolute Bay (and whether this is a benign scientific expedition)? Satellite image analysis tells the story:

Today the Northern Hemisphere sea ice area broke the record for the lowest ice area in recorded history. The new record came a full month before the historic summer minimum typically occurs. There is still a month or more of melt likely this year. It is therefore almost certain that the previous 2005 record will be annihilated by the final 2007 annual minima closer to the end of this summer.

The quote that the report’s author made to the media is rather more dramatic:

William L. Chapman, who monitors the region at the University of Illinois Urbana-Champaign and posted a Web report on the ice retreat yesterday, said that only an abrupt change in conditions could prevent far more melting before the 24-hour sun of the boreal summer set in September. “The melting rate during June and July this year was simply incredible,” Mr. Chapman said. “And then you’ve got this exposed black ocean soaking up sunlight and you wonder what, if anything, could cause it to reverse course.”

it’s turtles all the way down

Wednesday, August 1st, 2007

Snapping turtles are fairly widespread, from southeast Canada down the eastern US coast. However, their habitats are quickly disappearing and their aggressive behaviour makes them somewhat problematic to study (especially at night).

A group of biologists computer engineers at the University of Massachusetts have built a hardware and software platform that tracks the movement and habits of snapping turtles. The mobile platform, glued to each turtle (sorry, but it is common practice and can be more humane than radio collars), consists of a GPS unit, a solar panel, and antenna. The platform also contains a USB drive to keep a turtle-specific log of information.

For computer engineers, the idea behind the project is

a network of constantly moving devices that record and store information, transmit data from one device to another, then relay all the saved information to a central location while running on self-charging batteries.

“A lot of the existing technology works great as long as you’re not moving around and you have stable networks and people who could recharge batteries,” said Jacob Sorber, a doctoral candidate in computer science who designed the network he calls TurtleNet, a project funded by grants from the National Science Foundation.

From another site, check out live webcams of turtles, which combines nature and public participation in Japan.

the rise of the geoweb: user as consumer and producer of map content

Saturday, July 28th, 2007

This NYTimes article has the phenomenon exactly right, as to the potential to the user (actual and assumed power over the map), the opportunities for the geoweb vendor (billions in advertising dollars) and the challenge to the cartographer and GISer (whence the role of the expert).

[M]illions of people are trying their hand at cartography, drawing on digital maps and annotating them with text, images, sound and videos.

In the process, they are reshaping the world of mapmaking and collectively creating a new kind of atlas that is likely to be both richer and messier than any other.

The article has some nice links to geolocations on Google Earth (e.g., biodiesel stations in New England). You should visit the URLs and save them before they disappear behind the firewall.

More on this, as soon as I finish reading Andrew Keen.

sundance goes green

Monday, July 16th, 2007

Posted by Christopher Barry, Senior Vice President, Digital Media and Business Strategy, Sundance Channel

Here at the Sundance Channel, we recently launched a weekly programming block dedicated to the environment, called THE GREEN.

As part of this online environment, Google Maps for Enterprise technology offered us a great platform for developing the Eco-mmunity Map, an exciting interactive tool that supports our television shows and creates a community of users around eco issues. The Eco-mmunity Map allows you to list and search for green individuals, businesses, special attractions, and action points anywhere in the world through a customized site. The Google Maps technology makes it simple to share information about environmental causes and events in your community. You can input and search for green information based on four key category “markers” — Individuals, Businesses, Green Action Points, and Green Attractions and Events. By posting markers with detailed descriptions, contact information, related web links, comments, ratings, and photos, you can share local knowledge and suggestions with others from around the world. So come on over to www.sundancechannel.com/map and start adding your content today.

Ultimately, our hope is that visitors to the Eco-mmunity Map will have the opportunity to share their knowledge and connect with others in the virtual green movement. We’re grateful to the Google Maps for Enterprise team that helped make this online world possible.

Even the advertisements are for green products.

geoweb and communicating climate change

Saturday, July 14th, 2007

More heartening news that the geoweb (GIS, digital earths) could aid in communicating climate change:

In the article, Satellite Images Bridge Understanding Gap between Climate Change and Individuals, Kevin Corbley reports on a meeting between remote sensing vendors and Google Earth to promote the idea that geoweb could connect people to what was happening at the Earth’s poles, where climate change is particularly severe.

Some interesting examples in the article:

An application that allows users to view multiple layers of geospatial data linked to locations on Google Earth images: Earth SLOT (Earth Science, Logistics, and Outreach Terrainbases)

SPOT Imagery’s initiative to get climate change related imagery to the public: Planet-Action

There is some irony in the article in a quote from a SPOT Imagery representative:

SPOT’s de Chassy pointed out that while Earth observation satellites have been extremely successful at identifying environmental change, the link with everyday citizens has often been difficult to establish because imagery historically has been too expensive to obtain and too difficult to analyze for anyone but a trained scientist.

Yes, and who was setting the high prices for the images?

Update: Sierra Club British Columbia uses Google Earth to show the impact of sea level rise on the lower mainland of BC.

Step by step instructions on using Google Earth to show sea level rise in the coastal community of one’s choice.

Geospatial Web for climate change

Tuesday, June 26th, 2007

via geowanking, a content aggregation tool for climate change. GIS is a bit of a gimmick but it’s a good initiative.

To increase awareness and the availability of environmental information, the IDIOM Media Watch on Climate Change provides a comprehensive and continuously updated account of media coverage on climate change and related issues. The portal aggregates, filters and visualizes environmental Web content from 150 Anglo-American news media sites.

The vision of a Geospatial Web promotes the convergence of geographic information, Internet technology and social change. Taking a step towards this vision, the Media Watch on Climate Change uses automated content analysis to extract geospatial context and build a geotagged knowledge base. The interface provides various means to interactively access this knowledge base. It shows that geobrowsers are not only suited to explore geographic features, but can also render other types of imagery such as two-dimensional ‘Semantic Maps’ or three-dimensional Knowledge Planets.

Acquiring, managing and applying knowledge are crucial steps in addressing environmental issues effectively, and ensuring that change is conceived and implemented on both regional and society-wide scales. Over the next year, the Media Watch will be extended into an interactive “Collaboratory” that brings together the scientific community, the commercial world, and non-governmental organizations (NGOs). These stakeholders are often divided by differing worldviews, goals, and agendas. The collaboratory will provide matchmaking services for ad-hoc team composition, and support the day-to-day activities of online communities through content aggregation and advanced visualization services.

the future of geospatial technologies?

Friday, June 1st, 2007

Where 2.0 Conference: 20 something Red Bull-fueled geogeeks (or geowanks) in start ups all talking about the geoweb. Heads of Google Earth, Virtual Earth, Planet9, Swivel, Twittervision, Open Street Maps, and an assorted bunch of LBS Social Networking types. Also old school codgers like me (??) and Jack Dangermond, who came to the con with zero groupies. GIS is looked upon with disdain and some hostility as holding back the Web 2.0 enabled geospatial universe.

Marrying-in is easy (and popular) with the Google family

Thursday, April 12th, 2007

The number of extensions being linked to Google Maps/Earth/Etc. is incredible. The coffee-table atlas is virtually obsolete (no pun intended). For example, have you ever wondered where Anseba is located? Visit http://www.maplandia.com/eritrea/anseba/ for all you need to know.

google earth and darfur

Tuesday, April 10th, 2007

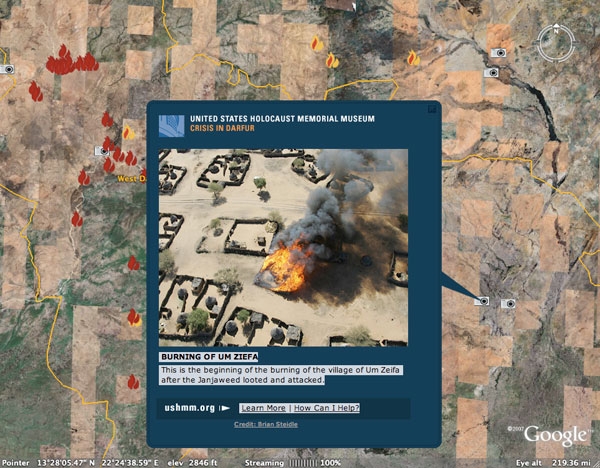
Google Earth teams up with the US Holocaust Museum to track the enormity of the first genocide of the 21st Century: Darfur in Sudan. There’s a wealth of information, both at the personal and the transnational scales. One can zoom in to see the stories of individual children or zoom out to bear witness to the sheer number of destroyed villages.

burning Darfur village

It would be an easy task to add geographic layers describing the public heath (e.g., water scarcity) and environmental devastation that often accompanies genocides.

google maps for communities

Friday, April 6th, 2007

Extreme Tech provides a detailed explanation on building your own community website by hacking Google Maps and Google Earth.

In addition to using GE and GM to build community sites for both community members and visitors, you could create an excellent green maps mashup.

Also check out GCensus on the same site, a way to create choropleth maps of census data, using Google Earth.