Thoughts on “Government Data and the Invisible Hand” (Robinson et al. 2009)

October 6th, 2019

This article’s main argument is that government public data should be available in an organized, easy to use and find manner for the general public and third-party organizations. I agree with the article’s general argument; the government should have the appropriate infrastructure to provide public data in a reusable and universal format.

The article points out that oftentimes the government does not keep up with the fast evolution of technology and web capabilities that emerge. This article was published in 2009, now in 2019, similar issues are still at play. In my own personal experience, this is still the case in the Canadian Government. There have been big steps taken within the Canadian Government to modernize and make use of the wide variety of tools available for data analysis and visualization for internal and external use.

A point important to highlight is that despite data being accessible, third-party organizations and citizens interested in creating web products to analyze and better understand the data being used to inform policy and regulation decisions, do not have all of the data required to see the full picture. In the case of the Government of Canada, data is split into three different categories, public and open data; protected data (Protected A, Protected B, and Protected C); and classified data (Confidential, Secret, and Top Secret). All of this data is used at different levels of government to make decisions – data that due to security and privacy is not accessible to the public.

I believe that along with making data easily accessible to the public, it is also the responsibility of the government to deliver a quality web product for the public to view the data in the way the government used it. This still allows for third-party organizations to create different ways to view the same data.
Thoughts on “Government Data and the Invisible Hand”

October 6th, 2019

In “Government Data and the Invisible Hand”, Robinson et. Al outline the process and advantages for the American Government to grant open online access to their data, which would provide the ability for third-party organizations to broaden data accessibility and contribute themselves by making use of them. Furthermore, it is argued that the private sector is “better suited to deliver government information to citizens” if the data is easy to parse through, given their ability to quickly change the tools based on the public needs as well as their position as outsiders.

If we’re thinking about geospatial data in this context, an important question remains after reading this article, which specified that public data should be provided by the government “in the highest detail available”: wouldn’t there be privacy concerns in that regard? There could be occurrences where the highest detail available for a dataset compromises the identity of individuals or groups if the spatial scale is fine enough. There would still be a privacy concern with non-geospatial data, as some sensitive information about individuals would have to be withheld from the public, meaning that a censorship would have to be done in order to preserve every citizens’ privacy. Alternatively, different political administrations could differ in what they deem acceptable and unacceptable for public access based on their own political positions. Finding a perfect balance between data accessibility and minimizing security concerns for the population is an extremely difficult challenge, as each and every one could have a different view. These differing subjective views could drastically affect the ability of private actors to make use of the data, especially if the administration has a veto in terms of what should or should not be publicly accessible.

All in all, I personally think that it is the government’s responsibility to first determine what constitutes sensitive data, as preserving privacy is of utmost importance. Following that, making all its non-sensitive data easily available online and promoting their use would go a long way to further our understanding of studied phenomenons using the data, but also improving society’s trust in government given a higher level of transparency.

Thoughts on “The Cost(s) of Geospatial Open Data”

October 6th, 2019

This article introduced the potential costs brought by open data. Two categories of costs are identified in this article: direct cost and indirect cost. The direct cost of open data can be understood as collecting raw data, preparing data, and maintain the uploaded data. Then the author listed four indirect costs of open data: 1) issue aroused by citizen participation and engagement, 2) difficulty in reaching a sole standard due to unevenness of data provision, 3) tension between government expense and private sector use, and 4) the privatization of open data in private sectors.

I am very interested in the privacy issue in open data due to previous experience with crime datasets. In one previous project, I worked with Toronto Crime Datasets from its government open data portal, and I found out in the data acknowledgement that those points data have all been calculated by certain algorithm so that they won’t necessarily represent the true location of each events. Since this data is available to everyone who have access to the internet, I understand that this calculation is for privacy protection. This little change did not impact much to my project. However, what if some researches really need these kinds of information? Should the government giving out the raw data despite the privacy issue? What rationale should they use in terms of considering giving out sensitive datasets? To me, this is a dilemma of open data should be open or not, and the rationale of this question might also differ between different area or territories.

Open data and bureaucratic thrift

October 6th, 2019

After reading through both of the articles this week, I’m reflecting on previous conversations and experiences I have had with open data and government access. I was especially impressed by the thoroughness of the “5 Myths” section of Janssen et al, which did an excellent job of unpacking some of the rhetoric and misinformation surrounding the current trend of open government data.

In reading both, I did feel that one aspect of open data was especially under-addressed, and could be explored further – the cost-saving factor motivating governments decisions to release open data to the public. As the size of the data sets local and national government actors manage has grown, the burden of managing those has increased. Keeping this data private and making careful decisions about who has access, what requests to authorize, and how to manage it quickly becomes a bureaucratic leviathan as the data sets exponentially increase. By making these data sets public, the labor and infrastructural costs of managing information access requests are massively reduced, making the governments work far easier. Many governments have adopted a policy that data is by default “open”, and unless policy makers and data managers specifically believe a certain data set should be private any new information generated is immediately available for public dispersal.

This dynamic has been explained to me multiple times by policy-makers at the city level, and I have personally seen its efficiency. In many ways this cost saving motivation provides more support for the argument at the center of Robinson et al, which is that data is better left in the hands of outside actors whereas it is the governments responsibility to ensure that what data is accessible is easily managed. The previous comment stated that “Public officials tend to focus on the number of datasets they release rather than on the effect of releasing high-quality sets of data.” I believe that the best explanation for this decision is the cost-saving factor I outlined above.

The costs of open geospatial data (Johnson et al. 2017)

October 6th, 2019

Open data has become a big movement in local governments. This article raises concerns over the costs incurred in the process of government data provision. The idea that making government data freely accessible – especially when geospatial data is involved – would create direct and indirect costs.

The authors suggest that direct costs must include considerations of individual privacy and confidentiality. Indeed, privacy protection may create direct costs, but government officials must ensure that all open data respects and only discloses information that cannot be attached to individuals. For instance, journey data is being used in a variety of ways to create and improve geospatial data products and to deliver services to uses. The journeys people take can be used to infer where they live, where they work, where they shop. If individuals become unwilling to share movement data, then this will impact the ability for that data to be used in ways that create economic and social benefits.

Besides direct costs, Johnson et al. (2017) identify four areas where the provision of open geospatial data can generate unforeseen expenses. They indicate that the private sector pushes for the release of “high value” datasets to develop their commercial products or services. This could divert governments’ attention from “low value” data. However, note that high-value data could also have a significant impact on citizens. People are taking advantage of applications that made use of open data. Transit commuters know how long they’ll be waiting for a ride. Drivers easily find parking close to where they want to travel to. Renters get detailed information about crime and school for any address. The information that developer access to inform these applications come directly from high-value datasets.

One way to reduce costs is to limit what data sets are published. Public officials tend to focus on the number of datasets they release rather than on the effect of releasing high-quality sets of data. Cities should do a careful analysis of which datasets have the most impact, both in terms of social and economic benefits, so as to avoid hidden costs.

Reflections on Government Data and the Invisible Hands

October 6th, 2019

The core proposal of Robinson et al’s work is to promote operational change on how government should share its public data. They point out that the reason for U.S. government agencies tend to have out-of-date website and unusable data is due to regulation and spending too much effort on improving each agency’s own website. Thus, they propose to hand the interaction part of public data, to third-party innovators, who has far superior technology and experience on creating better user interface, innovative reusable data, and collection of users’ feedback.

Although, under current trend of U.S.’s regulation and laws of sharing public data, it is true if the distribution of public data is better operated by third party innovators for better distribution and surplus value creation. I would argue, however, their work is missing some perspective on U.S’s current public data.

The first is standardization, it is more urgent for a public data standard to come out from the government, to ensure data quality and usability, rather than distribution. The top complaining of public data is that even data from the same realm (economic data), can end up very differently from different agencies who published it. This create more severe issue on the usability and accountability of the data, than distributing the data. So. in order for government agencies to become good public data “publishers” in Robinson et al’s proposal, all government agencies have to come up with a universal understandable and usable data standard, rather than each agencies using their own standard, or left the most basic part of data handling to private sector.

The second issue from their proposal is credibility of the data. If all public data is handed over to the public by third-party innovators, for increasing their own competitiveness, they will modify the original data to match what the public want, in stead of the original unmodified data. This create credibility issue, since there is way less legislation and regulation on what third-party distributors can and cannot do to the originally published government data. And this modification is inevitable for third-party distributors, since at least they need to modify the original public data to fit in their database.

At the end, I do think commercializing public data distribution can promote effective use and reuse of public data. Meanwhile create problems in all business, privacy issue, “rat race”, and intended leading on the exposure of more public-interested product, etc.. It will have its pros and cons, but before government agencies can solve their data standardization issue, and regulations are built to supervise third-party distribution of public data. Whether there will be more pros of Robinson et al’s proposal than cons remains questionable.

Reflecting on The Cost(s) of Geospatial Open Data (Johnson et al, 2017)

October 5th, 2019

This paper examines the rise of geospatial open data, particularly at the federal level. It looks at very concrete, monetary costs, such as resource costs, and staff time costs; it also looks at the less concrete and maybe less obvious, indirect costs of open data, such as when expectations are not met, and the potential for more corporate influence in the government.


In an economics class that I am currently taking, we discussed the seven methodological sins of economic research, and I believe some of these points can transcend disciplines. For instance, one of the sins is reliance on a single metric, such as a price or index. I think it’s important to note that when the authors of this paper were discussing costs, they did not just include monetary costs in their analysis. I believe the addition of the indirect costs is an important component to their argument and that these indirect costs present even more pressing issues than the direct costs do. I think it is very important to acknowledge the far-reaching and even harder-to-solve problems of the effects and influences of citizen engagement, the uneven access to information across regions, the influence of the private sector on government open data services, and the risks of public-private collusion through software and service licensing. 


A critique I have of the paper is that I believe the title to be a bit misleading in its simplicity. The title implies that the paper addresses geospatial open data cost across disciplines, whereas the paper addresses the costs only at the government level, and not any other level (for instance, perhaps looking at OSM or Zooniverse, if crowdsourcing/VGI falls under the same category as open data). The abstract, however, makes it very clear that the paper is only addressing issues caused by government-provided open data.

Thoughts on “The Cost(s) of Geospatial Open Data”

October 4th, 2019

This article framed the direct and indirect costs of geospatial open data provision, with the main focus on the four types of indirect costs. I found this article very thought-provoking because we often think of the benefits provided by open data whereas neglecting the pitfalls that it brings.

One point that particularly interests me was the data literacy issue. The article points out that there exist a number of barriers for users so that even though the data is open there is no guarantee of its use. Similarly, Janssen et al.’s (2012) article argues that these barriers pose the risk that open data is only publicized data in name but is still private in practice. Two points that I want to make here. First, while I understand the advocacy for better data quality and standardized data format, what I want to hear more about is that why does it matter for both researchers and the public to be able to use the data. One could argue that not many people would actually care and researchers are the group that those data meant for. Is public engagement in using and interpreting the open data instinctively good, or does it provide greater returns for the public? I think this could be better clarified here. Second, I’m curious about if VGI or crowdsourcing data belongs to the category of open data.  Dose the costs discussed in the article still apply to VGI and crowdsourcing data? It’s clear that some direct costs such as the cost of data collection could be avoided, but it seems to me that some other issues such as privacy and data quality could be intensified. I think this a question that worth to be discussed.

sliding into scales; i didn’t like the Atkinson & Tate paper very much, but still love scale!

September 30th, 2019

Scale is something people from lots of backgrounds pay attention to. Ecologists, biologists, geographers, and physicists all wrap their data into ‘packages’ of what they perceive to appropriate – in terms of what their data represent, the framework by which their data was collected and managed, and the question they seek to answer. By packages, I mean a sort of conceptualization of the data and the underlying model it is situated in / in which it is embedded. While many fields are entangled with scale, GIScientists have determined this is their time to shine – to explain core realities common to all spatial problems.

Some quick things that caught my attention:

  • the importance of scale in geography is based on the link between scale and modelling;
    1. makes me think about how geocomplexity is defined by geo-simulation
  • the notion of a spatial framework that determines what data is and what it represents by being the ‘strategy’ by which all information is ‘filtered’;
    1. the authors talk about how we see with our brains, not our eyes: aren’t we all just socially-informed machines?
    2. sort of fits into the narrative (geo)complexity scientists push: that we are embedded in a complex system worth modelling
  • the idea that something can be homogenous at one scale, and heterogenous at another;

The five categories presented in Atkinson and Tate to breakdown and understand what exactly Spatial Scale is are helpful, although I felt lost in discussion of spatial variation & stationarity. Something I thought I would be able to grasp quickly since my true geographical love is movement. But no. Still lost.

In the work I get to do with Prof. Sengupta, we explore how landscape heterogeneity affects animal behaviour selection and therefore determines movement. It’s neat that we get to wrangle with many of the concepts Atkinson and Tate discuss: collecting data at some frequency; rescaling data to represent what we want it to represent; considering spatial extent; and dealing with spatial dependence (by mostly not having dealt with it). Right now, we are exploring movements of a troop of olive baboons in Kenya. I wonder how our representative trajectories would look at half the sampling frequency – would we still be able to employ ‘behaviour-selection’ in the way we are trying? I don’t know – much to learn from the ‘is-it-a-science-or-isn’t-it’ science.

I perceive Professional Geographer to be a journal of decent quality in the field – for not many reasons beyond that they are found in our lab-space, scattered amongst old machines, super-powered servers, and sensors not sensing yet. Going into the reading with this perception, I was left disappointed. For a paper taking issue with how data is represented, communicated, and handled; there is failure to really understand what the authors are doing – maybe mostly on my part, but there is certainly some shared culpability. While scale is indeed complicated, and discussing it can be hard and technical, I think the authors have failed to simplify and communicate their field in what is meant to be a paper for all geographers to engage with. Obfuscation and lack-of-transparency will kill this field.

Thoughts on The Scale Issue in the Social and Natural Science (Marceau, 1999)

September 29th, 2019

Marceau thoroughly introduced the scale issue in geographic, or any researches related to spatial and temporal scale issue. It refers to the difficulty of understanding and using the “correct scales”, as phenomenon of interest may only occur in certain scales, and the study result might be various due to the use of alternative combinations of areal units at similar scales.

To explain scale issues in social science and natural science, Marceau focuses on MAUP (Modifiable Areal Unit Problem) in the realm of social science, and scale and aggregation problems at natural science. As progress has been made for the last few decades, the MAUP problem still remain unsolved (according to Marceau, by 1999) , but studies on how to control and predict its effects were developed to get close to solve the problem. While in natural science, HPDP (Hierarchical patch dynamics paradigm) was provided to solve the scale and aggregation problem in natural science, as a framework of combining bother vertical and horizontal hierarchy problem.

In the end of his introduction of scale issue, Marceau threw out three main steps of solving the scale issue: understanding scale dependence effect; the development of quantitative methods to predict and control the MAUP effects, as well as to explain how entities, patterns, and processes are linked across scales (aggregation problem); and to build a solid unified theoretical framework, which hypothesis can be derived and tested, and generalizations achieved (Marceau, 1999).

The most intriguing part of this article to me is the MAUP problem. Although progress has been made to control and predict its effects on the study result, from some of the recent urban geographic studies I have been read, the MAUP problem is still unsolved. And sometimes, ignored when researchers talked about their sampling process. From Marceau’s explanation, I do realize that it is important to address scale issues, such as MAUP in both social and natural science studies, in order to figure out whether the study result is solid and spatially valid, and avoid unexpected spatial bias.


Thoughts on “Spatial Scale Problems and Geostatistical Solutions: A Review”

September 29th, 2019

This article talks about scale, which is a key information in spatial variation. Scale as a concept has a lot of definitions. Outside the field of geography, it can be used to describe the size or extent of certain event or process. However, scale often referred to as cartographic scale in geography. In physical geography, scale is often represented using ratio value (e.g. 1:1000); while in human geography, scale can often be represented using units such as division, city, and province. In either study, defining a suitable scale is really important. If the original dataset is not appropriately scaled, it would be very useful if the dataset and easily be rescaled. In my past project, I had working on two different census dataset with different unit. When using them separately, they all worked very well. However, it took me a lot of efforts to co-register this two datasets in order to use them simultaneously. This makes me wonder if we were trying to build a dataset, what would be the criteria of a suitable spatial scale. In other words, how do we characterize suitable in this case.

This article then brought up the concept of spatial variation. It was first introduced to me as a part of point pattern analysis. Kriging is also introduced as a method to estimate and then interpolate missing data values. However, it has a ‘smoothing’ problem. Is there any better way to solve this problem since I noticed that this article was published in 2000, which is very early.  And with the extensive development of computer science algorithm, is there any new interpolation technology that can minimize this problem?

For “A Review on Spatial Scale Problems and Geostatistics Solutions”

September 29th, 2019

This paper points out that nearly all environmental processes are scale-dependent in general because the spatial data are captured based on observations that is dependent on sampling framework with the particular scales of measurement – filtered version of reality. Moreover, the author reviews recent literature revealing scale problems in geography and holds a few discussions on the geostatistical techniques for re-scaling data and data models by introducing scales of measurement, scales of variation in spatial data and the modelling of spatial variation. Some approaches to changing the scale of measurement are suggested in the end. Adopting a conceptual framework that fits scales of the spatial variation and the scales of the spatial measurement and learning more details about the structure of the property do matter a lot when dealing with a scale-related geographic issue.

I appreciate this paper a lot for it helping me think more about scale issues in my thesis research. One of my research questions is to find if regular patterns do exist at large scale peatlands over the landscape by exploring the large-scale pattern of peatlands in one of the typical peatland landscapes–Hudson Bay Lowland. “Scale” referring as resolution and extent plays an important role when raising up my research project. The emergence of regular spatial pattern from the scale of several meters (hummocks and hollows), to tens of meters (pools, ridges and lawns) has been confirmed and the regular pattern together forming the stable individual peatland ecosystem (bogs, swamps and fens). However, there has been a lack of studies at the larger scale — hundreds of kilometers of massive peatland complexes. We inferred that the characteristics of regular patterns revealing the negative feedbacks are cross-scale transferrable which gives rise to the hypothesis that regular pattern still exist at large scale making itself a self-regulated system that is adaptive to the climate change. When it come to the implement of data collection and processing on remote sensing data, “which scale is most suitable to detect the heterogeneity between grids with a limited cost of image request” is the first step. How large the area I want to deal with(extent) and how much detail(resolution) I want in distinguish heterogeneity? If interpolation used for creating more high-resolution images, how much information is lost or mislead?

“SCALE issues” matters a lot, helps a lot, bothers a lot…

Thoughts on Spatial Scales Problem and Geostatistical Solutions

September 29th, 2019

In this article, the authors highlighted the importance of spatial scales  in geography and the often need of rescaling data for multi-scale analysis. They raised the problem that due to the scale-dependent spatial variations, this rescaling process is very difficult. To solve this problem, they proposed some geostatiatical approaches for modelling the spatial dependence (variogram) and to predict the effects of rescaling (generalization). They suggested that this should be the first step for addressing scale-dependence problem.

The discussion of scale-independence processes reminds me of Anderson’s (2018) article “Biodiversity Monitoring, Earth Observations and the Ecology of Scale”, in which author discussed the need of muti-scale modelling and multi-scale mapping for biodiversity monitoring. The author explained that since the biodiversity pattern is driven by multiple ecological processes that act across different scale, there is no single best scale of measurement. However, translating patterns across different scales is challenging because of the scale mismatches of the data. I think this is a good example of how scale can play an important role in GIScience and it is also where the geostatistical approaches come into play.

One doubt that remains to me is related to one of the main critiques of geostatistcal approach(or modelling approach in general), which is the need of prior understanding of the spatial processes. Nowadays as more and more data-driven approaches is available (e.g. machine learning) and challenging the model-driven approach, does geostatistical approach still have a place in data analysis? I would like to learn more about the comparison of the two types of approaches.

The Modifiable Areal Unit Problem

September 29th, 2019

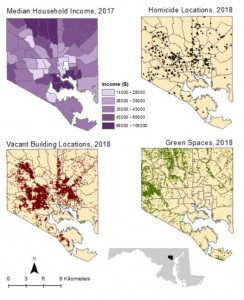
I was pleased to read so much about the modifiable areal unit problem (MAUP) in Marceau’s discussion of scale, as last semester this was a constant thorn in my side. In one final project, I had major issues with the aggregate problem he describes. I was trying to correlate homicide locations in Baltimore to different spatial characteristics, namely socioeconomic status, green space, and vacant buildings. I had the location of every homicide in Baltimore in 2017, vacant building in Baltimore, and a layer file for every park and green space in the city. However, for socioeconomic status I only had the average income for large swaths of the city called “community statistical areas;” these were not nearly as granular as the homicide locations, vacant building sites, and green spaces. There were no better spatial data for socioeconomic status that I could find, so these were the data I used. My analysis revealed that, using these data, both vacant building locations and green spaces are significantly correlated to homicide locations but income is not. However, this does not prove that neighborhood income isn’t correlated to homicide incidence as the income data I used are low resolution compared to the other data (see the maps below for comparison). I happened to conduct multiple regression models for this project, the exact type that Marceau cites as being vulnerable to the MAUP: “the authors [of one study on the MAUP] demonstrated that modification of the areal units from which data are collected create a severe problem for parameter estimation in multiple regression models” (1999). Therefore, I was right to be cautious about the conclusions drawn from my own Baltimore analysis. In addition, I will have to keep the MAUP in mind for my GEOG 506 project as my theme is geodemographics and any demographic data I use will certainly be aggregated to some scalar unit.

MAUP

Thoughts on “Marceau – The Scale Issue in the Social and Natural Sciences”

September 29th, 2019

In “The Scale Issue in the Social and Natural Sciences”, D.J. Marceau explains the increase in the importance of the Spatial Scale concept and the evolution of its conceptualization over the last few decades by reviewing the main developments in both the social and natural sciences. This is illustrated in the article with many examples of contemporary environmental problems and how the observations will differ based on the selected scale of the analysis, as patterns may differ across scales.

In an era where geographic data is becoming more and more accessible online while also becoming more heterogeneous, scaling becomes an increasingly important issue to consider when analyzing space, given the ever growing reliance on Geographic Information Systems (GIS) today. Although science always aims to be as objective as possible, the lens through which a phenomenon can be observed can vary widely based on our culture, our social environment as well as the standards in use among many other factors.

The conclusion of the article proposes an emergence of what is referred to as the science of scale. I would be curious to know if there have been recent developments since the article was published in 1999. Do we have a better understanding of ways to control the distortion created by the Modifiable Areal Unit Problem (MAUP)? Also, have there been contributions made by other disciplines not mentioned in the article in regards to the scaling problem?

Spatial Scale Problems (Atkinson and Tate 2000)

September 29th, 2019

Scale is a complex topic with numerous definitions encompassed within diverse conceptual frameworks. For example, in human geography, scale may be perceived as a consequence of social behavior at different levels such as household, neighborhood, state, and nation. In this article, the spatial data analysis perspective is at the forefront, and a definition of scale which relates to spatial extent is used through this article. Atkinson and Tate (2000) divide spacial scale into two elements: 1. scale of spatial measurement, and 2. scale of spatial variation. Any analysis of spatial data is dependent on the support (e.g., geometrical size, shape, and orientation of the measurement units) and coverage of the data. Thus, characterizing the spatial scale of variation and how this relates to the measurement scale should be a fundamental part of any application of such data. Overall, this article provides a comprehensive account of spatial scale problems in geographical information science contexts and presents a variety of geostatistical approaches useful for characterizing scales of spatial variation and re-scaling data.

As a transportation geographer, I am particularly interested in the modifiable areal unit problem (MAUP), which lies at the heart of any analysis of spatial aggregation. Although spatial data are increasingly disaggregated, many studies on transportation geography require some level of aggregation (e.g., traffic analysis zones, census tracts, dissemination areas). Atkinson and Tate (2000) argue that MAUP can contribute to a significant loss of information in the aggregation of data in large units of geography. Indeed, the aggregation of the same data in different configurations of spatial units can lead to dramatically different results. Besides of the MAUP, we must also be cautious when we transfer relationship at the individual level to aggregates of individuals. For example, a survey can reveal that men ride bikes more frequently than women. However, one can measure lower cycling rate at census tracts with a higher share of male since these census tracts lack access to cycling facilities.

“Scaling” as a verb

September 28th, 2019

After reading through D.J. Marceau’s “The Scale Issue in the Social and Natural Sciences” paper, I’m left reflecting on some of the more abstract issues outlined at the beginning of the article. The paper does a good job of summing up the state of the issue of scale in academic geography as of 1999. This of course begs the question of what developments may have occurred around this field since then, and what effects that may have had on geospatial applications as GIS tech has become an everyday part of our lives.

I’m especially interested in this issue in relation to navigation apps and online mapping services for consumer use. The majority of the average person in the developed worlds interactions with geospatial technologies operate at two scales – that of a pedestrian and that of a vehicle, commuting a distance between 20 minutes and 2 hours. These scales are very specific, and we spend much of our lives operating within these bounds. I’m curious about how societal perceptions of space and distance have been affected by this pattern, and how our use of navigational aids may have locked us into certain mindsets about the scale of our lives and our communities.

I’m also curious about exploring the concept of “scaling” as a verb. It certainly has little to do with physical distance between things, as evidenced by the terms use in far more abstract conditions than the geographical sciences. A hierarchical worldview is implied by the use of the word scaling, and its application says to me a lot about how the user sees the world. What is the origin of hierarchical frameworks of organizing non-geographic information? Was is it inevitable that scientists structured the world this way? Did geographic hierarchical structures of thinking influence non-geographic conceptualizations of scale, or was it the other way around? The last question may be one of those chicken-and-egg ontological problems without a solution.

Spatial Scale Problems and Geostatistical Solutions: A Review (Atkinson & Tate, 2000)

September 26th, 2019

Atkinson and Tate provide a thorough overview of geostatistical issues and their solutions in this piece. Although the authors do make a point of simplifying concepts, I still had to read the article a few times to really understand what was happening. I would have greatly benefited from more examples to illustrate their points, or maybe one that was a bit simpler than the one they chose. Despite my difficulties in grasping everything that was said in the article on my first read, I believe this article to be an important starting point for those embarking on research where scale plays a major role. For instance, knowing about the smoothing problem when performing kriging analyses (and that the variance lost through smoothing can be estimated by subtraction) could be the difference between a successful project and an unsuccessful one. 

Some things I can’t help but wonder after reading this piece are:

What has changed in the literature since this was published in November 2000?

Is there now a solution to the covariance problem (ie that it varies unpredictably between the original and kriged data)?

This article made me think more about how scale can relate to my own project for this course, and what issues to avoid in my own research. I’ll be sure to look at more literature concerning the interaction of scale and VGI moving forward. Overall, I found this piece to be a solid overview of geostatistical problems and solutions.


Geospatial Ontologies Retrospective

September 24th, 2019

My initial reaction to the subject of geospatial ontologies was incredulity. Both of the readings I was assigned (Smith and Sinha) were well written, but in many ways seemed to be a stretch to me. Geospatial ontologies strike me as an entertaining philosophical game, similar to something like “the trolly problem.” – interesting to think about and discuss but more often than not irrelevant except in especially extreme circumstances. The subject of ontologies is applicable at a highly abstract scale, and often doesn’t have much to do with practical, day to day geography. I was unconvinced.

This view was challenged during the class on geospatial ontologies. As the breadth of the subject was explored, I began to consider its implications on my own thesis. Many of the models and systems I’m considering studying are built on abstract assumptions of universal ontologies, and require a certain academic geographical fluency to piece together. Ontologies underly all science, including geography, and its important to take them into consideration as further research is done.

After listening to the lecture on geospatial ontologies, readings the literature, and discussing the subject with my classmates, I have developed a slightly broader perspective. However, I have to admit that I do find the subject irritating nonetheless. Geospatial ontologies deal with fundamental discrepancies in the world, and are not easily resolved – meaning that even when they are not the subject of something they underlie the theory supporting it. The fact that its seemingly impossible to define mountain in a clean, universal way throws much of (what has traditionally been) the field of geography into doubt. This in turn makes it hard to feel confident in the outputs of any research in this field, and leaves one dissatisfied and frustrated if you expect a nice logical solution to this problem.

Thoughts on Reid & Sieber, 2019 ‘s article

September 24th, 2019

In this article, the authors argue that conventional geospatial ontology in GIScience often seeks to reach universality and interoperability, which could potentially lead to assimilation of indigenous culture. They proposed that some more inclusive and participatory approaches, such as hermeneutics and heuristics, should be applied when developing geospatial ontologies.

While I strongly agree with the authors’ opinion that the indigenous knowledge should have a place in ontologies, it is still unclear to me, how and how much indigenous knowledge we should engage when developing ontologies?  Do we engage all of the indigenous ontology or only a part of them? If we include all of them, would we still be able to achieve the interoperability in ontologies? For example, the place-based multinaturalist approach proposed in the article seems to support the idea that we should not leave out any indigenous culture and there is no universality, but to me, on the other hand, this means that we can hardly achieve interoperability. On the contrary, if we include only a part of them, who gets to decide what to include? Would it be the scientists or the indigenous people?

In my perspective, the development of ontologies or the seek for interoperability per se is more or less assimilation of indigenous knowledge, regardless of what approach we used. The approaches proposed by the article might contribute to less/slower assimilation of indigenous culture, but as long as the development of ontologies is led by the majority (which I assume most of the time it is?), indigenous culture would always be underrepresented. I couldn’t see any way that interoperability and the full engagement of indigenous culture in ontologies could me mutually achieved.